About Sisense
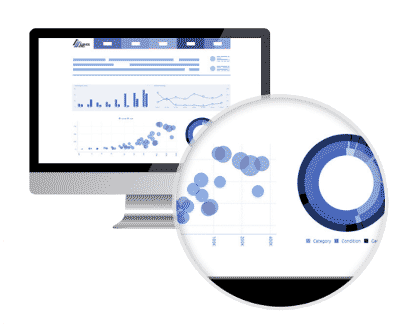
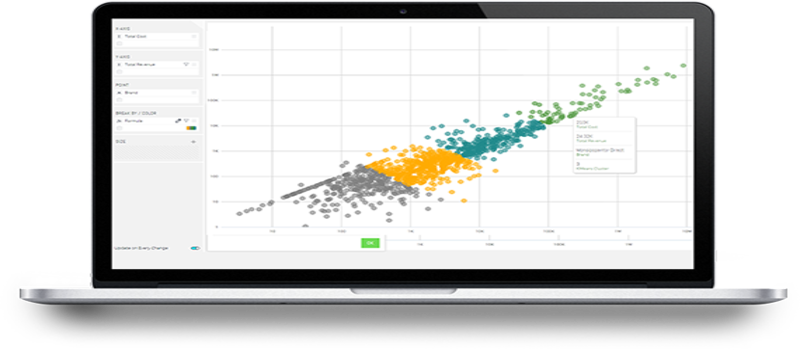
Sisense, headquartered in New York, is a Business Intelligence solution, designed to make analysis simpler by transforming complex data to visuals. With the detailed visuals, businesses can make informed decisions. Sisense lets you connect various data, even from multiple sources, to creates visual representation like graphs, charts etc. to analyze the data in a simpler way.


What’s Good in Sisense:
The software is visually appealing. The creation of visuals from data is outstanding!
You can connect data from different sources. That will be an awesome tool for the companies with tons of data with different sources.
The process of converting data to analysis is very fast!
Multiple visualization techniques to represent the data like bar chart, pie chart, line chart, area chart, column chart etc.
Creates an entire dashboard of the data. So, you can have a lot of information in graphical form on a single screen.
The prepared dashboards can be saved in pdf format.
Full Sisense Review:
As a software reviewer, I constantly look out for tools that can simplify the complex tasks, and one such example is Sisense. Sisense lets you convert various complex data to visual representation so that you can make informed logical decisions.
